OLSPlots.jl provides diagnostic plots in Julia for ordinary least squares
regression models prepared with GLM.lm. It's based on the plots method for the R
Programming Language's lm regression models. It differs slightly in the rendering
of loess lines due to a different algorithm in Julia's Loess package compared to
the R equivalent.
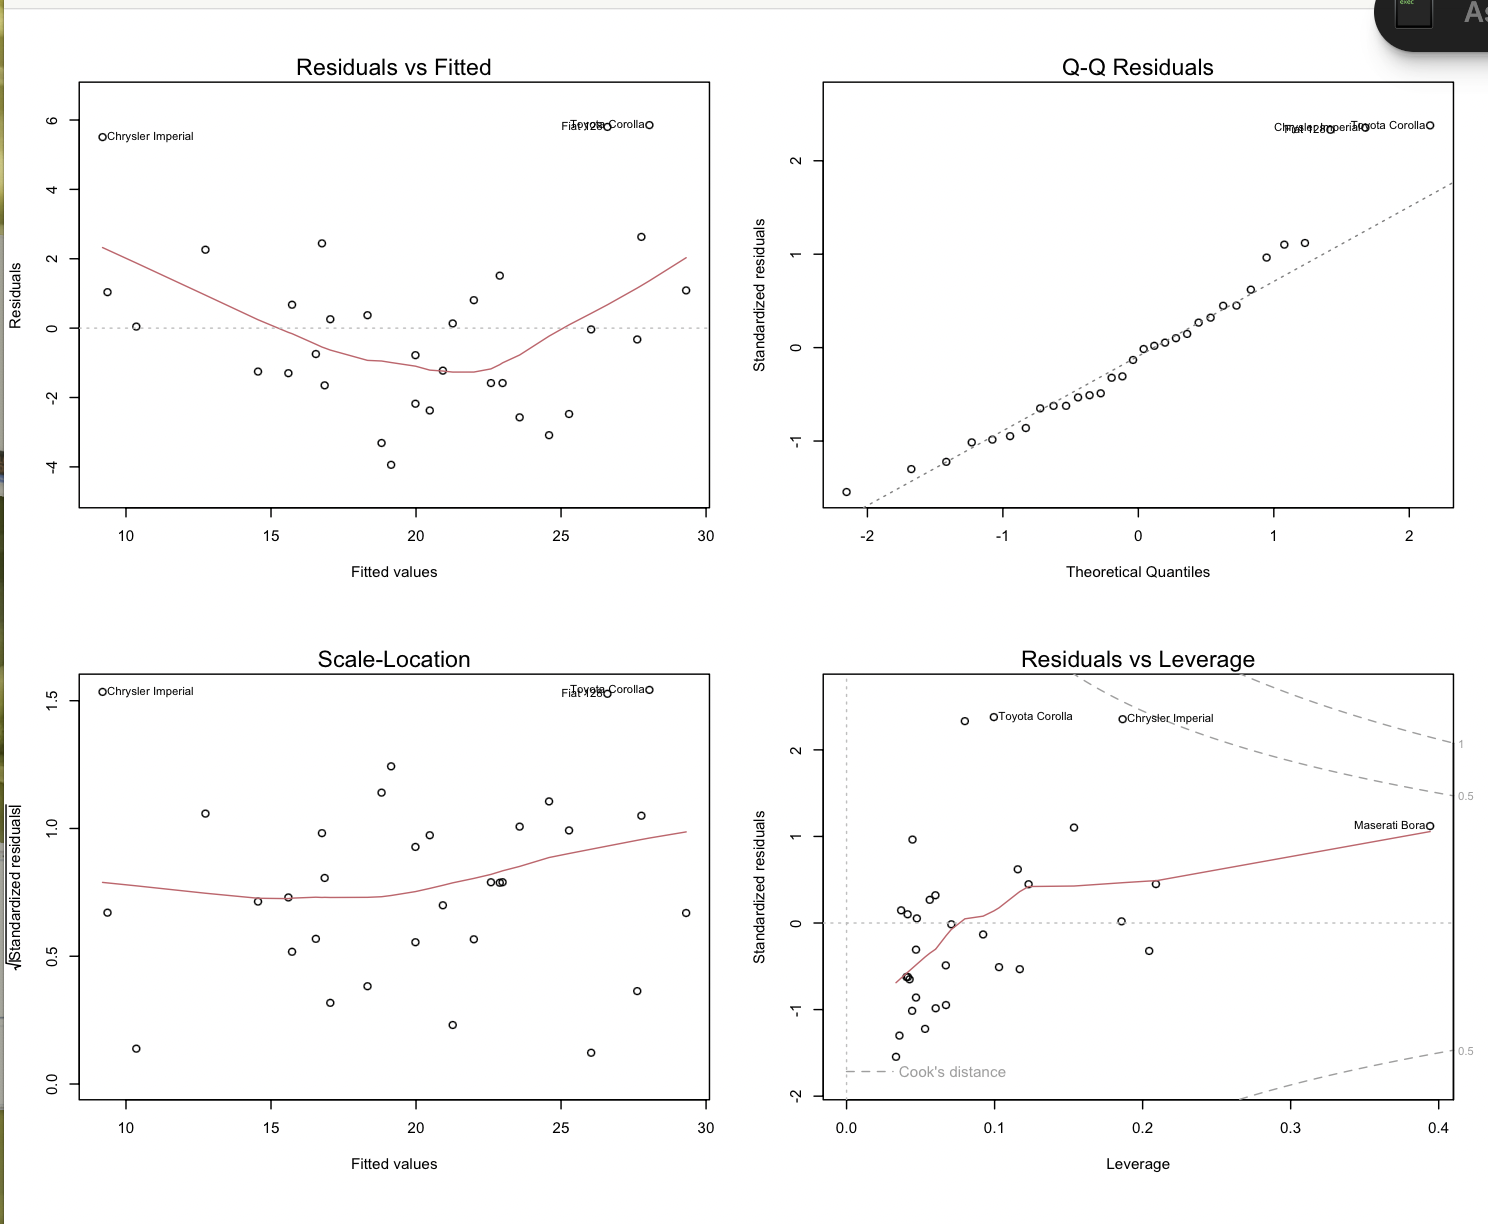
Using a simplified mtcars data set from R available here, the R implementation is as follows:
model = lm(mpg ~ hp + drat + wt, df)
plot(model)
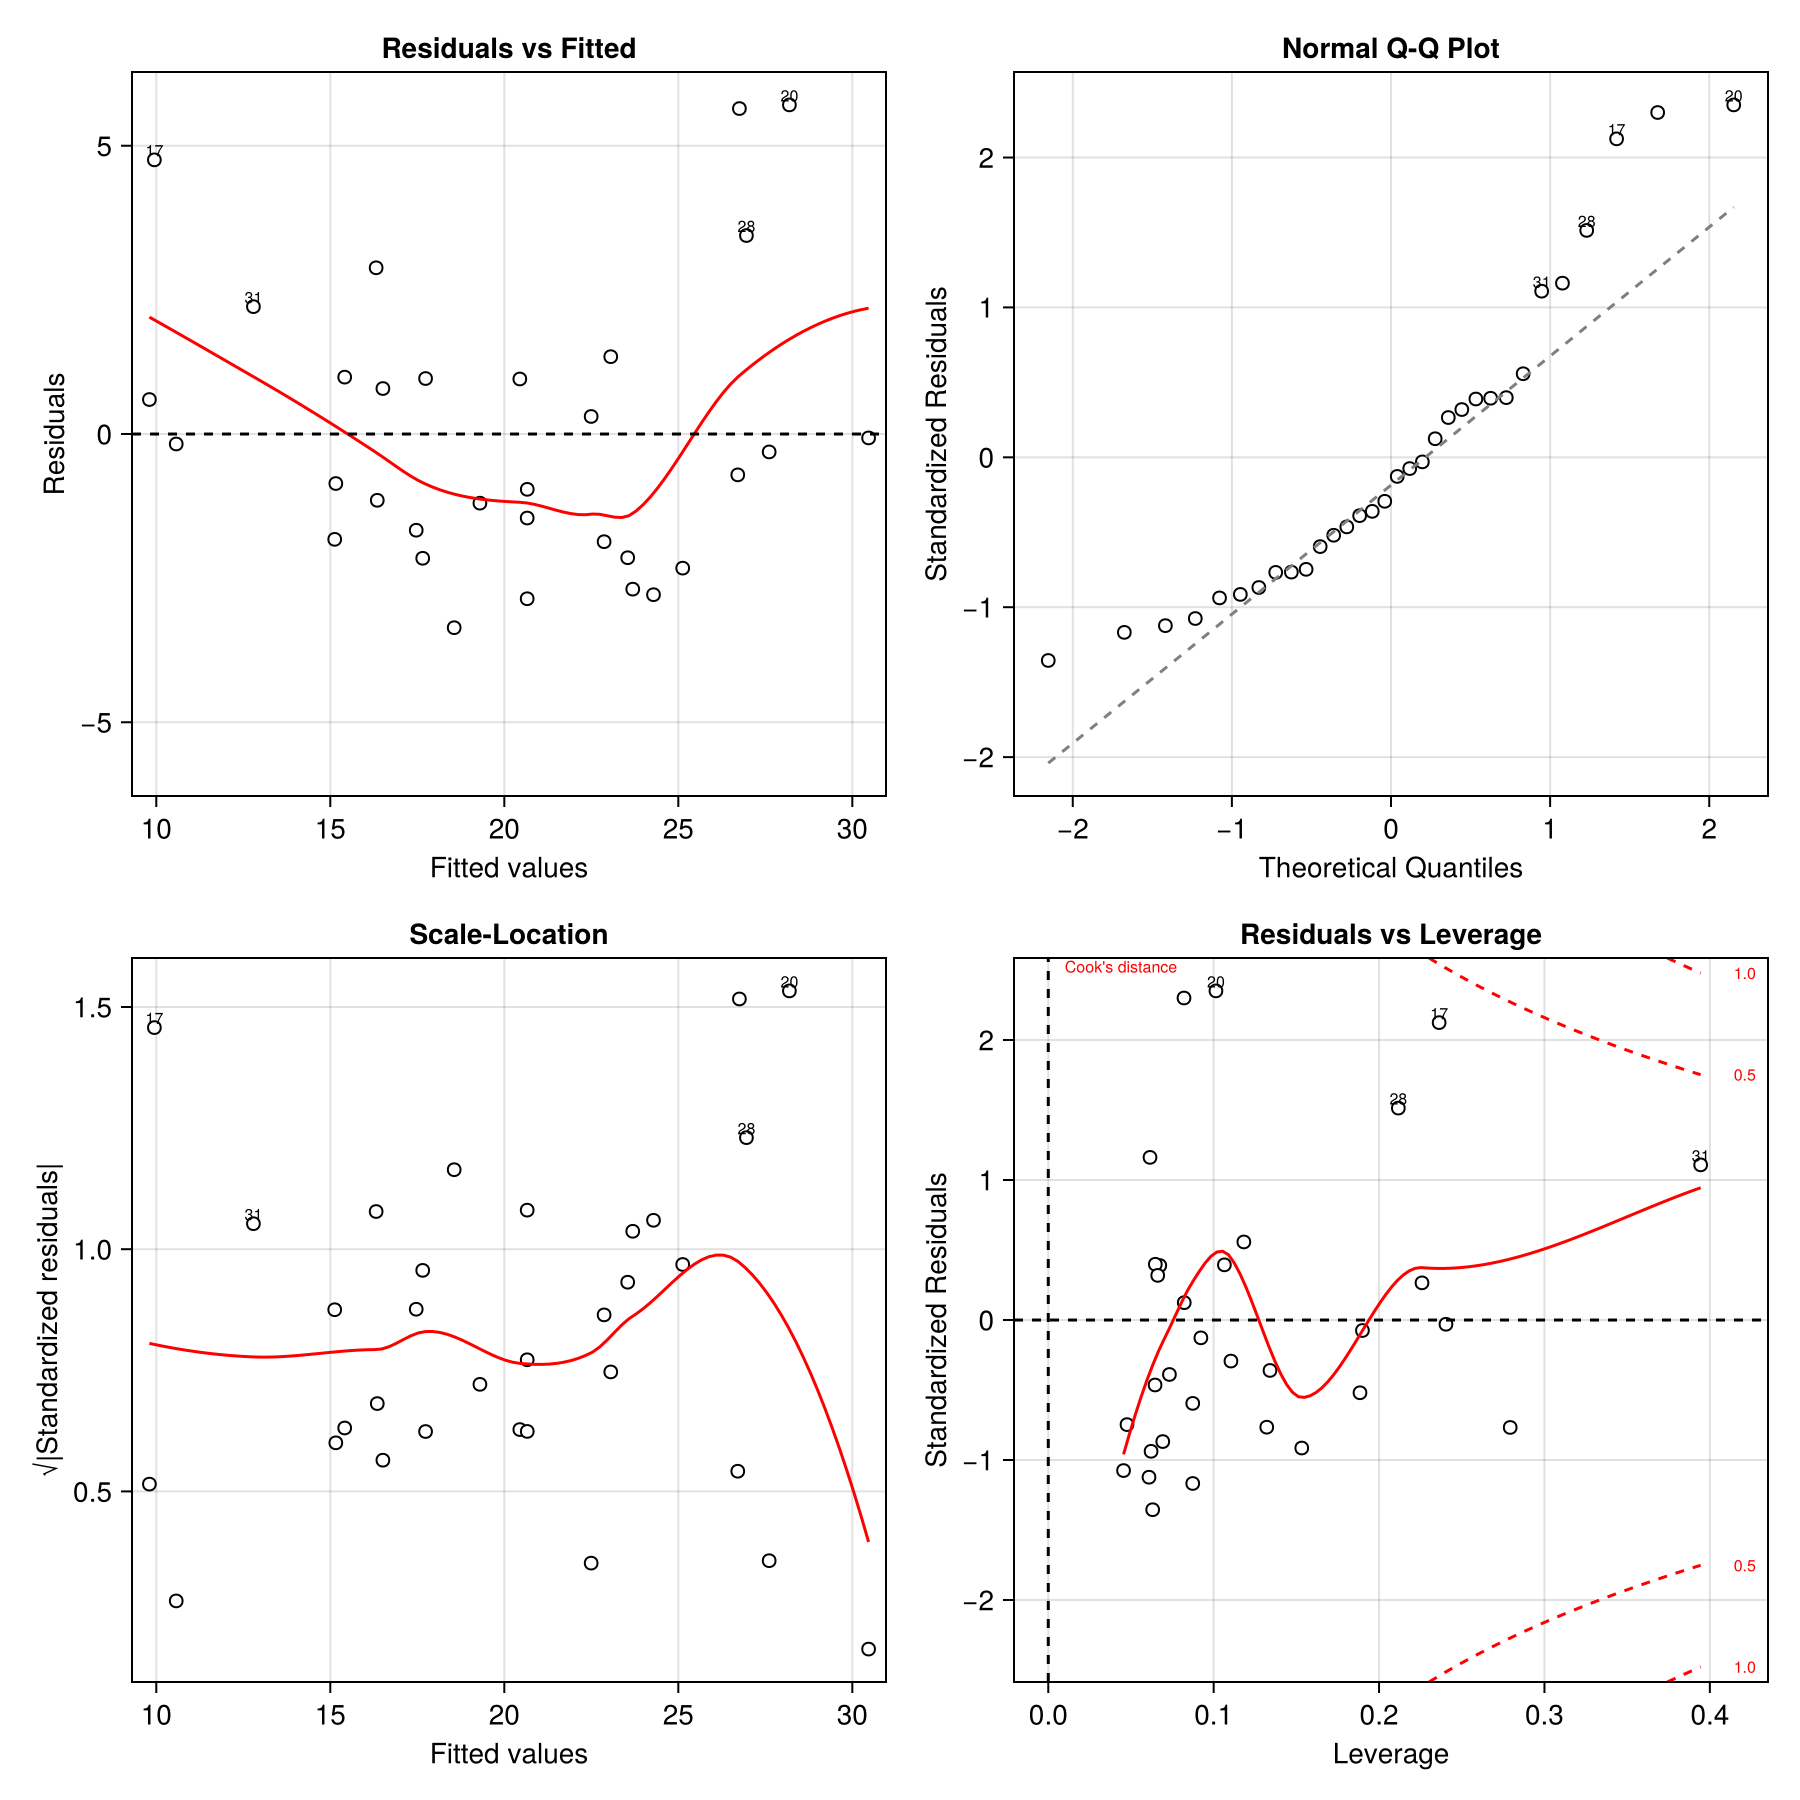
The corresponding Julia implementation is as follows:
using CSV, DataFrames, GLM, OLSPlots
mtcars = ("data/mtcars.csv", DataFrames)
model = lm(@formula(mpg ~ hp + drat + wt), mtcars)
diagnostic_plots(model)
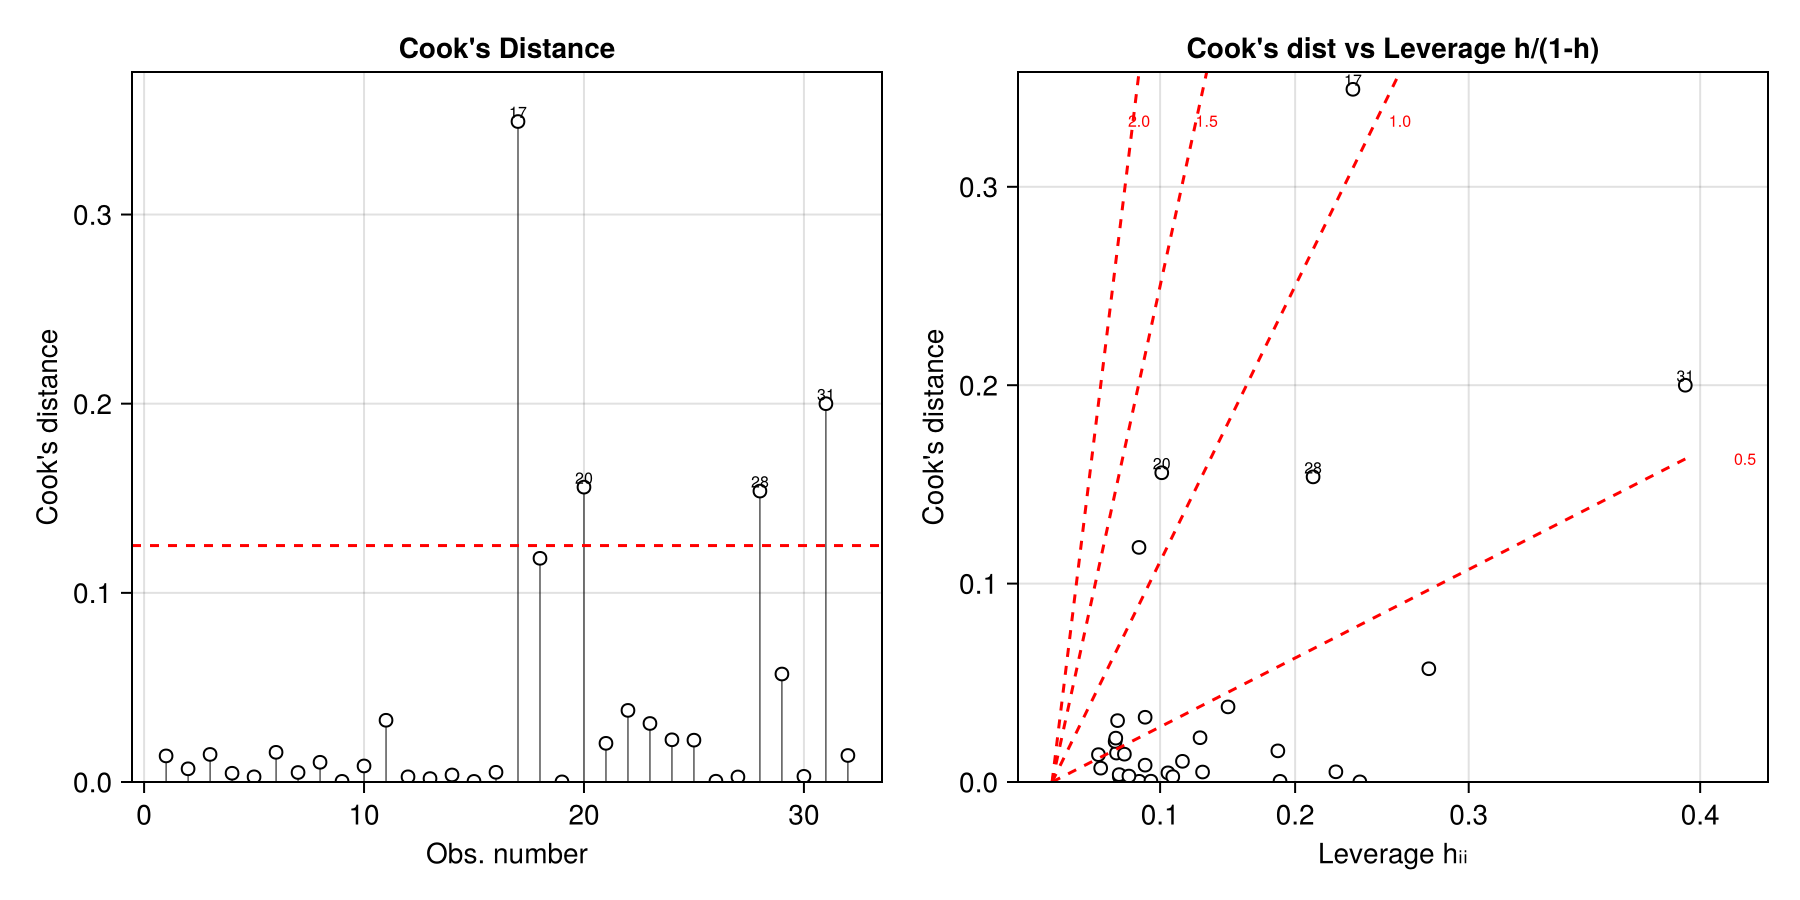
diagnostic_plots takes a which argument, a vector in the range 1:6 to selectively display plots. The default is [1,2,3,5]. To show the additional plots
diagnostic_plots(model, which = [4,6])
Additional details are in the documentation.